 Final Lab Week 9
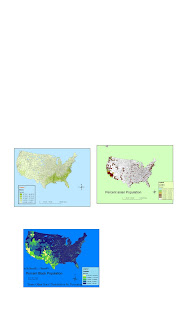
For this lab we had to download data from the US census website and put it into the Arch GIS program. The data started out as tabular, not spatial. Converting the data into a form that GIS could manipulate was the challenging part of this assignment. After the tabular data was converted to DBF files and put into Arch catalog then Arc Map.
The Data from the census was layered over data for the entire countries state boundaries. The data used was population data for different races in the US. Each map represents a different races population distribution for the country in percentage. The legends show what percent population each race coincides with what color on the map.
This lab shows how number or tabular data can be expressed visually on a map using colors and polygons. the main challenge of this lab was organizing and converting the data to a way the Arc Map software could visually represent it. Knowing how to convert files and where to put them is my biggest challenge in GIS so far. It is very difficult for me. Once the information is in the system it is more navigable and easier to combine datas and make data layers. The general tools bar is definitely more understandable to me than the spatial analysis tools. I still don't understand how to get the 3-D models to come up on the map. There are many aspects of GIS that I have yet to understand but this course definitely gave me a good start and somewhat of a working knowledge of the system. I hope that I can master this program someday and be able to effectively use the Arc GIS software to represent spatial data scientifically in order to benefit research projects and communicate environmental issues.
No comments:
Post a Comment